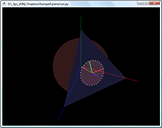
Here's the result:


VIEW THE CODE BELOW IN FULL-SCREEN (pyglet_pyeuclid_visualization_sample.py)
Code: Select all
#!/usr/bin/env python

# /*
# (c) 2010 +++ Filip Stoklas, aka FipS, http://www.4FipS.com +++
# THIS CODE IS FREE - LICENSED UNDER THE MIT LICENSE
# ARTICLE URL: http://forums.4fips.com/viewtopic.php?f=3&t=198
# */

from euclid import Vector3
from euclid import Matrix4
from math import sqrt
from pyglet.gl import *
from pyglet.gl.glu import *

def draw_line(p1, p2, color, width=1):
    glLineWidth(width)
    glColor4f(color[0], color[1], color[2], 1)
    glBegin(GL_LINES)
    glVertex3f(p1[0], p1[1], p1[2])
    glVertex3f(p2[0], p2[1], p2[2])
    glEnd()

def draw_coords(mtx, size, width=1):
    x = Vector3(size, 0, 0);
    y = Vector3(0, size, 0);
    z = Vector3(0, 0, size);
    orig = mtx[12:15]
    draw_line(orig, orig + mtx * x, (1, 0, 0), width)
    draw_line(orig, orig + mtx * y, (0, 1, 0), width)
    draw_line(orig, orig + mtx * z, (0, 0, 1), width)

def draw_sphere(radius, color, alpha):
    glEnable(GL_BLEND)
    glBlendFunc(GL_SRC_ALPHA, GL_ONE_MINUS_SRC_ALPHA)
    glColor4f(color[0], color[1], color[2], alpha);
    sphere = gluNewQuadric()
    gluSphere(sphere, radius, 50, 50)
    glDisable(GL_BLEND)

def draw_triangle(p1, p2, p3, color, alpha):
    glEnable(GL_BLEND)
    glBlendFunc(GL_SRC_ALPHA, GL_ONE_MINUS_SRC_ALPHA)
    glColor4f(color[0], color[1], color[2], alpha)
    glBegin(GL_TRIANGLES)
    glVertex3f(p1[0], p1[1], p1[2])
    glVertex3f(p2[0], p2[1], p2[2])
    glVertex3f(p3[0], p3[1], p3[2])
    glEnd()
    glDisable(GL_BLEND)

window = pyglet.window.Window()

@window.event
def on_resize(width, height):
    glViewport(0, 0, width, height)
    glMatrixMode(GL_PROJECTION)
    glLoadIdentity()
    gluPerspective(45, width / float(height), .1, 1000)
    gluLookAt(
     1, 4, 3, # eye
     0, 0, 0, # target
     0, 1, 0  # up
    );
    glMatrixMode(GL_MODELVIEW)
    return pyglet.event.EVENT_HANDLED

@window.event
def on_draw():

    a = 1.6
    b = a * sqrt(3) / 3
    r = sqrt(1 - b*b)
    R = Vector3(a, a, a).normalized() * b
    cs = Matrix4.new_translate(R[0], R[1], R[2]) * Matrix4.new_look_at(Vector3(0, 0, 0), R, Vector3(0, 1, 0))

    glDisable(GL_DEPTH_TEST)
    glClear(GL_COLOR_BUFFER_BIT | GL_DEPTH_BUFFER_BIT)
    glLoadIdentity()
    draw_coords(Matrix4.new_identity(), 2)
    draw_line((0, 0, 0), R, (1, 1, 0))
    draw_coords(cs, r, 3)
    glEnable(GL_DEPTH_TEST)
    draw_triangle((a, 0, 0), (0, a, 0), (0, 0, a), (.5, .5, 1), .2)
    draw_sphere(1, (1, .5, .5), .2)

pyglet.app.run()